I'll declare my interest up front: I'm someone who might one day be the subject of a local poll, so I have every incentive to tell you polls are rubbish when they're against me and gospel when they're for me. I'd rather just explain how they work, so you can judge them yourself — including any that involve me.
The short version: a well-designed national poll is a genuinely useful instrument with known limits. A poll of a single council ward is much harder to do properly. And an online poll in a community Facebook group measures who felt like clicking, which is not the same thing as what the community thinks.
01 / The basicsWhat a poll actually is.
A poll asks a sample of people a question and uses their answers to estimate what everyone would say. That works — genuinely, mathematically — but only if the sample resembles the population. Almost everything that goes wrong in polling goes wrong at that step.
Figure 1 — The four things that determine quality
Judge a poll on these, not the headline.
Who was asked, and how they were chosen
Random selection from the whole population is the gold standard. People who chose to answer — clicked a link, opened an app, replied to a group post — are a self-selected sample, and self-selection is the single biggest source of error in the polls you see shared online.
How many were asked
Sample size sets the margin of error. Roughly 1,000 respondents gives about ±3 percentage points; 400 gives about ±5; 100 gives about ±10. Below a few hundred, the honest answer to "who's ahead?" is usually "we can't tell".
Exactly how the question was worded
"Do you support upgrading the local pool?" and "Do you support spending $40 million of ratepayer money on a pool?" are different questions about the same project, and will produce different numbers. Always look for the exact wording. If it isn't published, be suspicious.
Who paid for it, and did they publish everything
Commissioned polls aren't automatically dishonest — but a poll released by an interested party showing a convenient result, without the full question set, sample details and field dates, is marketing rather than research.
A reputable pollster publishes methodology, sample size, field dates and question wording. If you can't find those four things, you're looking at a number, not a measurement.
02 / Margin of errorThe most ignored number in politics.
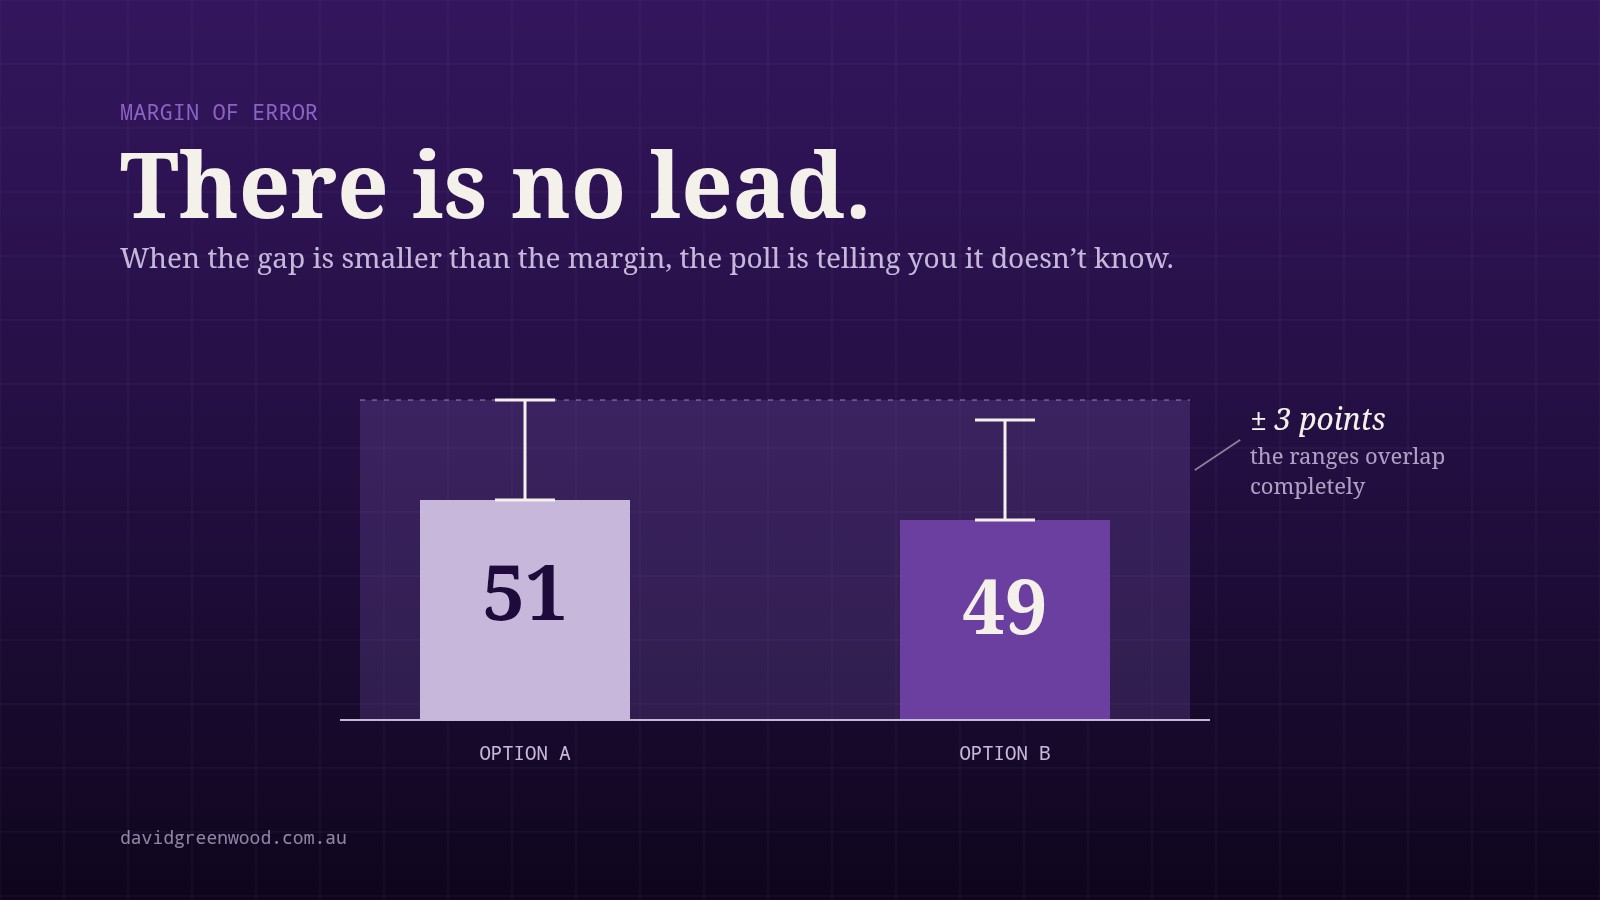
Margin of error is why "51–49" headlines are so often nonsense. If a poll of 1,000 people carries a margin of about ±3 points, then 51–49 means the real figure could plausibly sit anywhere from 48–52 to 54–46. The race is a coin toss and the poll is telling you so — but the headline says someone's winning.
Figure 2 — Sample size and precision
What each sample size can actually tell you.
| Respondents | Approx. margin of error | What you can honestly conclude |
|---|---|---|
| 2,000 | ±2 pts | Reliable national picture; gaps of 5+ points are meaningful |
| 1,000 | ±3 pts | Standard national poll; anything inside 6 points is unclear |
| 400 | ±5 pts | Broad direction only; close results tell you nothing |
| 100 | ±10 pts | Little more than a vibe check |
| 30 | ±18 pts | An anecdote with a percentage sign attached |
Indicative figures for a simple random sample at the conventional 95% confidence level. Real polls carry extra error from non-response and weighting, so treat a published margin as a floor rather than a ceiling. Note too that the margin applies to each figure — the margin on the gap between two numbers is wider still.
03 / When it went wrongAustralia, 2019.
The clearest Australian example is the 2019 federal election. Published polls had consistently pointed to a Labor win, and the result went the other way. It was significant enough that the Association of Market and Social Research Organisations commissioned an independent inquiry into what had happened.
The broad conclusion wasn't fraud or conspiracy. It was that the samples were unrepresentative — skewed toward more educated and more politically engaged respondents — and that the weighting used to correct for that didn't fully fix it. Because every pollster was making a similar adjustment, the errors all pointed the same way instead of cancelling out. That's called herding, and it's why "all the polls agreed" was reassurance rather than evidence.
When every poll is wrong in the same direction, the problem isn't one pollster. It's a shared assumption nobody tested. — the lesson of 2019
04 / When it went right2022, and 2023.
Polling isn't broken, and it's worth being fair about that. Two counter-examples:
Broadly right — 2022 federal election
After the 2019 review, pollsters revised their methods. The 2022 result — a change of government, with a notably large crossbench — sat much closer to what published polling had indicated.
Broadly right — 2023 referendum
Polling through 2023 tracked a clear and sustained decline in support for the Voice referendum and correctly indicated it would not pass. The trend was visible for months beforehand.
The pattern across all three cases is consistent: polls are decent at direction and trend, and poor at precision. "Support has fallen steadily over four months" is a strong finding. "Candidate A leads 51–49" usually isn't a finding at all.
05 / Local pollsWhy ward-level numbers are the hardest.
This is where I'd urge the most caution locally, because the maths is genuinely unforgiving. A council ward in Greater Geelong holds a small fraction of the state's voters. To poll one ward to ±5 points you need a properly drawn sample of several hundred residents of that ward — which is expensive, slow, and almost never what has actually been done.
Figure 3 — Local polling problems
Four reasons ward-level polls mislead.
Tiny samples
A "poll" of 60 residents in one suburb carries a margin around ±13 points. That can't distinguish a landslide from a loss.
Self-selection
Community group polls reach people already engaged enough to be in the group — typically older, more opinionated, and not evenly spread across the ward.
No preference flows
Council elections here are counted preferentially. A first-preference snapshot tells you very little about who ultimately gets elected.
Low name recognition
Plenty of voters genuinely haven't decided, or don't know the candidates, until the ballot arrives. A poll months out measures familiarity as much as intention.
None of this makes local polls worthless. It means treating them as a rough temperature reading of engaged residents — useful for spotting which issues people care about, close to useless for predicting a result.
An online community poll measures who clicked, not what the community thinks. There's no random selection, no weighting, no verification that respondents live in the area, and often nothing preventing the same person voting twice.
That doesn't make them pointless — they're a fast, honest way to start a conversation, and I've learnt useful things from them. It makes them unpublishable as evidence. If you see one presented as proof that "the community wants X", it isn't.
06 / Reading any pollSix questions to ask.
Figure 4 — Your checklist
Before you believe a number.
Method
- How many people, and how were they selected? Random beats self-selected, every time.
- What's the margin of error? If the gap is smaller than the margin, there is no lead.
- When was it in the field? A poll taken before a major announcement is history, not news.
Motive
- What was the exact wording? Not published means not verifiable.
- Who commissioned and paid for it? Legitimate to do — but relevant context.
- Were all results released, or just the good ones? Selective release is the most common form of poll spin.
If a poll passes all six, take it seriously — within its stated margin. If it fails three or more, it's a talking point dressed up as data.
07 / My own positionWhy I don't lead with polls.
I'd rather be judged on a record than a survey, and there's a practical reason as well as a principled one: at ward level, nobody can poll accurately enough for the number to mean much. Anyone waving a local poll around — for me or against me — is asking you to trust a figure with a margin wide enough to hide the entire result.
What I do find genuinely valuable is the unglamorous version: knocking on doors and asking people what's actually bothering them. When we surveyed residents about local issues, the value wasn't a percentage — it was the list of things that came up unprompted, over and over. That's not a prediction. It's a priority list, and it's far more useful.
So by all means read the polls. Just read the methodology first — and remember that the only poll with a zero margin of error is the one where everybody votes.