Every figure on this page comes from the ABS 2021 Census, and I've said which geographic area each one covers — because "Lara" means three slightly different things depending on which ABS boundary you use, and quoting the wrong one is how honest people end up circulating wrong numbers.
01 / What's well established
The broad shape
- Lara, Little River and the Avalon growth area are among the fastest-growing parts of Greater Geelong
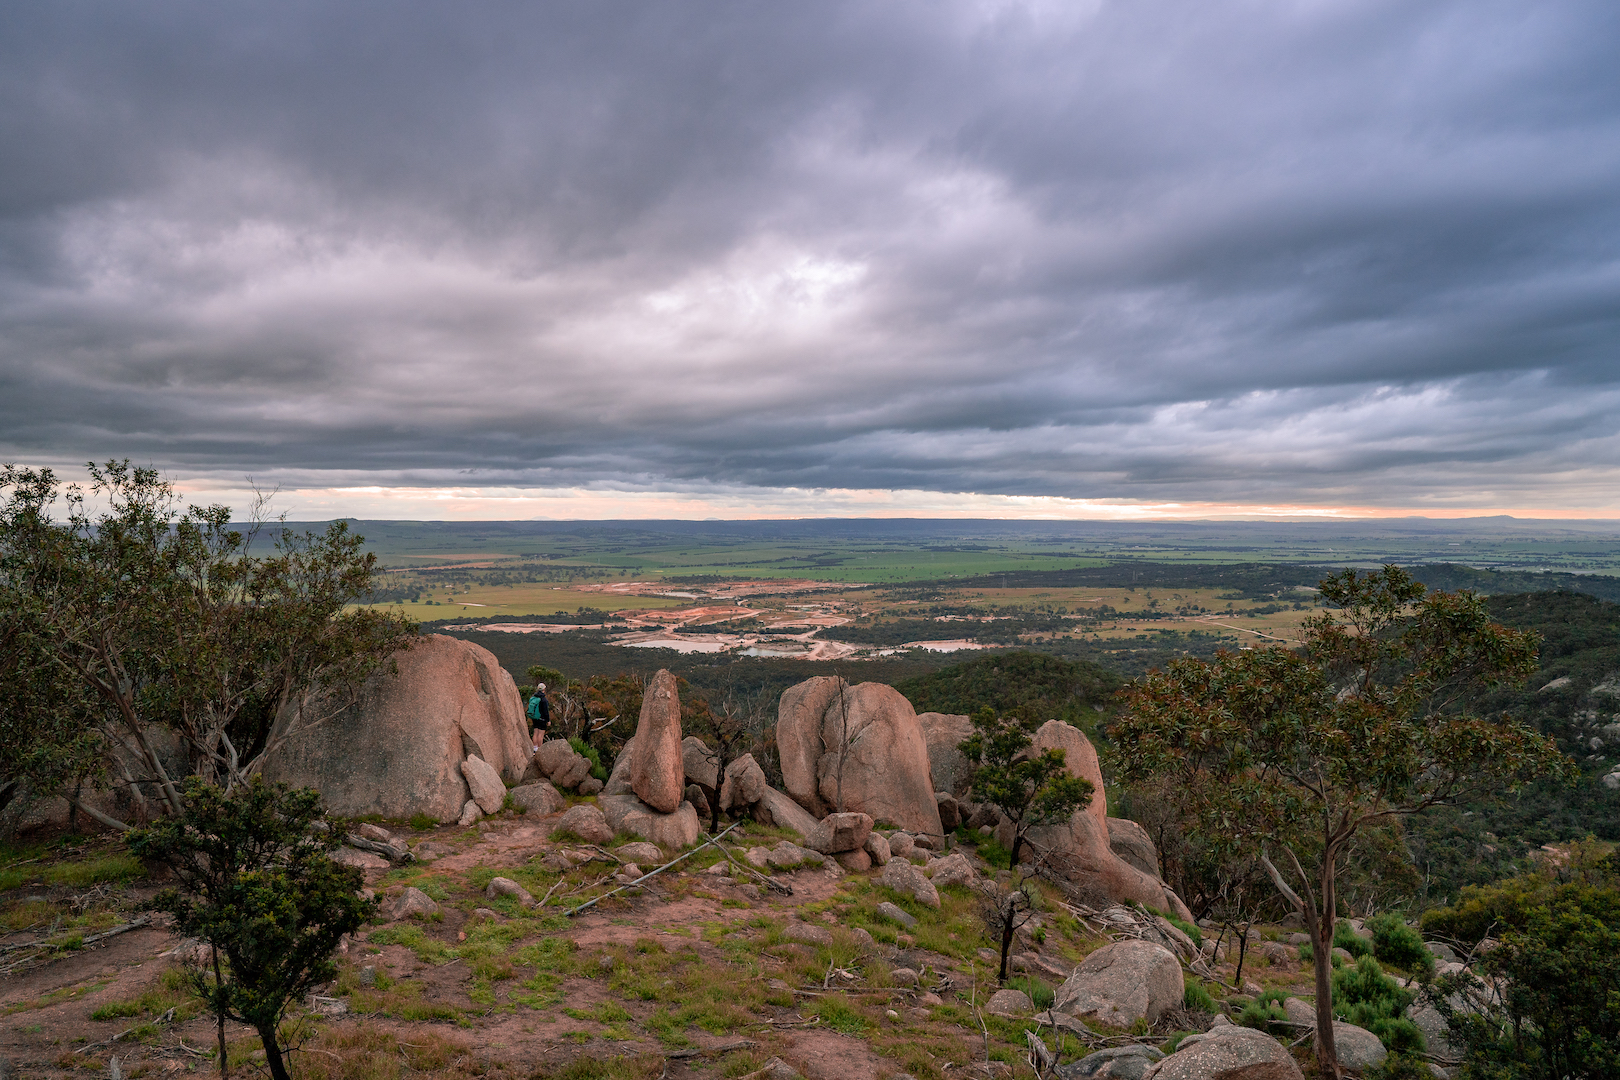
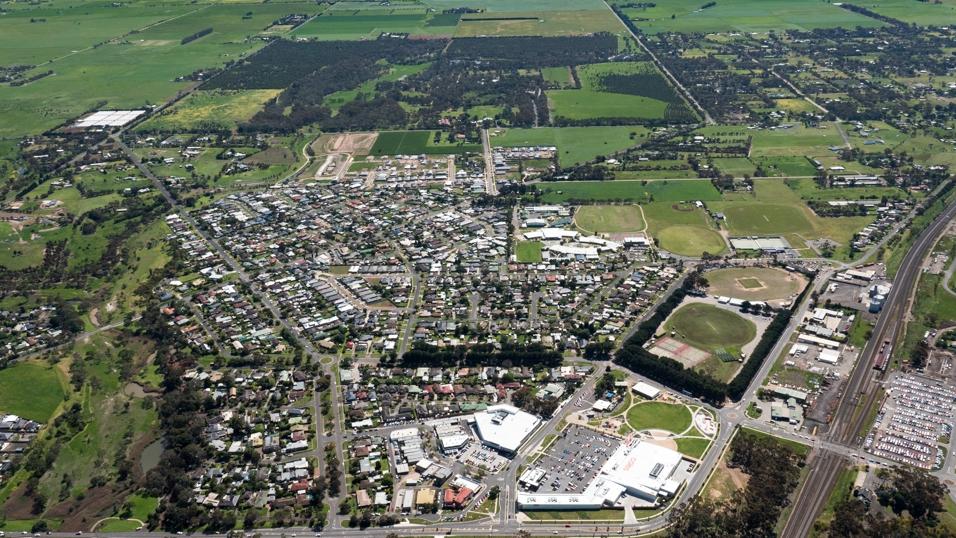
- The ward covers a mix of established township, new residential estates, and large rural and industrial land (Avalon Airport, the You Yangs, farmland toward Bacchus Marsh)
- A working rail line runs through the middle of the ward, connecting Lara to both Geelong and Melbourne
Exact figures
- Current population and dwelling counts
- Median age, household size, income
- Year-on-year growth rate
02 / The actual numbersLara, 2021 Census.
Here are the real figures for Lara from the 2021 Census. An important caveat first: these are ABS figures for the suburb of Lara (area code SAL21469), not the whole You Yangs Ward — the ward also takes in Little River, Anakie, Avalon, Staughton Vale and rural land that the suburb boundary excludes. Where the wider ABS "Lara" statistical area (SA2 203021043) differs, I've noted it. Everything below is 2021, so it's now several years old in a fast-growing area.
Figure 01 · Lara, 2021 Census — the headline figures
Population and households.
| Measure | Lara (suburb) | Victoria |
|---|---|---|
| People | 19,014 | 6,503,491 |
| Median age | 37 | 38 |
| Families | 5,018 | — |
| Private dwellings | 6,843 | — |
| Average people per household | 2.7 | — |
| Average children per family (families with children) | 1.9 | — |
| Average motor vehicles per dwelling | 2.1 | — |
The wider ABS "Lara" SA2 — which captures more of the surrounding area — recorded 20,817 people, 5,479 families and 7,516 private dwellings, with the same median age of 37 and 2.2 vehicles per dwelling. Source: ABS 2021 Census QuickStats.
Figure 02 · Income and housing costs
What households actually earn and pay.
| Measure | Lara (suburb) |
|---|---|
| Median weekly household income | $1,969 |
| Median weekly family income (SA2) | $2,227 |
| Median weekly personal income (SA2) | $827 |
| Median monthly mortgage repayment | $1,733 |
| Median weekly rent | $370 |
Two vehicles per dwelling on average, alongside a median household income of roughly $102,000 a year, tells you something structural: this is a community where car ownership isn't a lifestyle choice, it's a requirement of living here. That's directly relevant to every transport and footpath decision council makes.
Figure 03 · Age structure and community
Who lives here.
Younger than the state median
- 0–4 years: 1,292 people (6.2%) — above Victoria's 5.8%
- 5–9 years: 1,402 people (6.7%) — above Victoria's 6.2%
- Around a quarter of residents are under 20
- Roughly 15% are aged 65 or over
- The largest single cohort is 25–34
Composition
- Male: 52.1% Female: 47.9%
- Aboriginal and/or Torres Strait Islander: 424 people (2.0% in the SA2) — double Victoria's 1.0%
- Around 81% of residents born in Australia
- Christianity the largest reported religious grouping (48.5%)
The over-representation of 0–9 year-olds relative to the Victorian average is the single most policy-relevant figure on this page. It is the reason school capacity, kindergarten places, playgrounds and safe walking routes are the ward's most pressing service pressures — and it was already true in 2021, before several more years of growth.
03 / Where to get exact and current figures

Figure 04 · The real sources
| Source | What it gives you |
|---|---|
| ABS QuickStats / Census data | Population, age structure, household income, dwelling type — down to the suburb level |
| .id (population.id.com.au) | Greater Geelong's own commissioned population forecasts, often more current than the Census between count years |
| City of Greater Geelong Council Plan | Ward-level context used in council's own strategic planning |
| Victorian Electoral Commission | Enrolled voter numbers by ward — a useful, frequently updated proxy for adult population change |
Census data is released roughly every five years and can lag well behind fast-growing areas like Lara — the .id forecast site is usually the more current source for a growth corridor between Census years.
04 / Why this matters for representation
A ward that's growing quickly needs its councillor to track that growth in real time, not rely on data that's already several years stale by the time it's published. Part of representing the You Yangs Ward properly is treating population growth as a live number that changes what infrastructure and services are actually needed — not a fixed fact from the last Census.
05 / How to read a Census figure properly
If you're going to look up ward data yourself — and I'd encourage it — a few things about how the numbers work will stop you drawing the wrong conclusion from a real figure.
Figure 05 · Reading the data honestly
| Trap | What to watch for |
|---|---|
| Boundary mismatch | ABS geographic areas don't align with council ward boundaries. A "Lara" figure may include or exclude areas the ward doesn't. |
| Census lag | Data is a snapshot from a single night, released roughly every five years. In a fast-growing area it can be materially out of date by publication. |
| Medians vs averages | Median income and median age describe the middle of the distribution. Averages get distorted by outliers — the two can tell quite different stories. |
| Small-area suppression | The ABS randomises or suppresses very small counts to protect privacy, so small-area figures may not sum exactly. |
| Forecast vs count | Population forecasts (like .id's) are modelled projections, not counts. They're often more useful for planning, but they are estimates. |
None of this makes the data unreliable — it makes it data. Knowing what a figure actually measures is the difference between using statistics and being used by them.
06 / The two wards inside one ward
The most important structural fact about the You Yangs Ward isn't a number — it's that the ward contains at least two quite different kinds of community, and any single statistic averages across them in a way that can mislead.
Lara and the growth estates
- Higher density, younger household profile in newer estates
- Growing school-age population
- Rail access; commuting to both Geelong and Melbourne
- Service expectations closer to a suburban standard
Little River, Anakie, Avalon, Staughton Vale, Maude
- Low density, dispersed, often long-established households
- Older average age in some pockets
- Car-dependent by necessity; limited or no public transport
- Different service needs entirely — road maintenance, fire risk, connectivity
A ward-wide average sits somewhere between those two and describes neither accurately. It's why "the ward needs X" is usually the wrong framing, and "which part of the ward needs X, and why" is the right one.
07 / The numbers that would actually change decisions
Population counts get the attention, but they're not the figures that most usefully drive council decisions. Four others matter more, and none of them are routinely published at ward level:
Figure 06 · What should be published per ward
All four already exist inside council systems. Publishing them per ward wouldn't cost anything meaningful and would replace a lot of arguing with a lot of checking.
08 / On getting numbers right
Every figure above is sourced and dated, and I've been explicit about which ABS boundary each one uses. That matters for a specific reason: a wrong number published by a candidate becomes a wrong number quoted back at council, and it undermines every accurate thing said alongside it. Where I've had to note that a figure covers the suburb rather than the whole ward, that's not hedging — it's the difference between a useful number and a misleading one.
So: the links above are the sources. If a number on this site is ever wrong, tell me and I'll correct it and say that I have.